Resources
Other Resources:
PDF Downloads
Click on PDF to download the full size document. You will need the free version of Acrobat Reader or another PDF reader to view the file.
Qualitative Impact of
Non-Medical Switching

How Non-Medical Switching
Hurts Patients

Co-Pay Accumulator
Adjustment Programs

Advocacy Insights:
Co-Pay Accumulators

How Non-Medical Switching
Step Therapy

Addressing Health Disparities for Black
and Hispanic People Living with Asthma,
Atopic Dermatitis, and Food Allergies

Video Resources
Understanding Prior Authorization
Barriers to Patient Access:
Prior Authorization
Barriers to Patient Access: Co-Pay Accumulator Adjustment Programs
The Co-Pay Surprise
Understanding Step Therapy
Barriers to Patient Access: Step Therapy
Non-Medical Switching Hurts Patients
Step Therapy and Skin Conditions
Skin Conditions and
Health Insurance Barriers
Infographics
Click on image to download the full size PDF. Print these out as an advocacy tool.
Step Therapy
Infosheet

Legionnaires’ Disease
Infosheet

Asthma Health
Disparities Infosheet

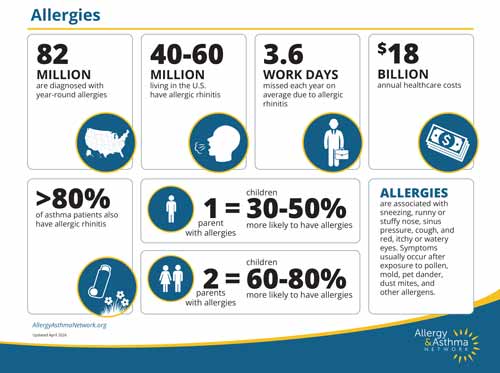
Allergy
Statistics
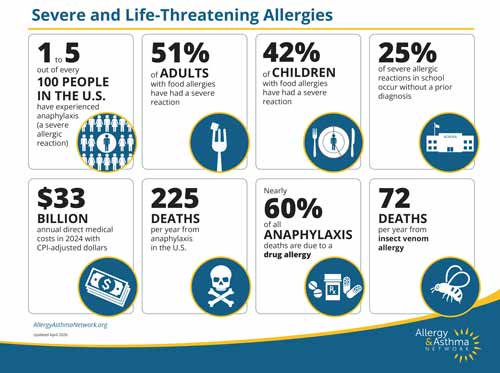
Life-Threatening
Allergies Statistics
Anaphylaxis-at-a-Glance
Infosheet

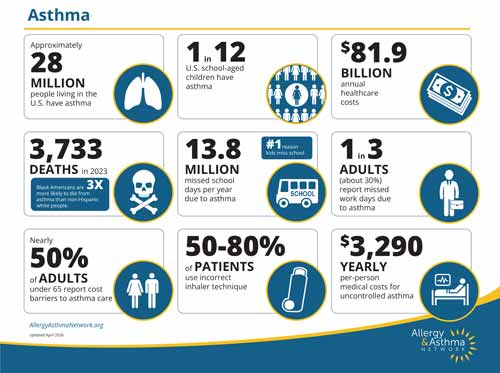
Asthma
Statistics
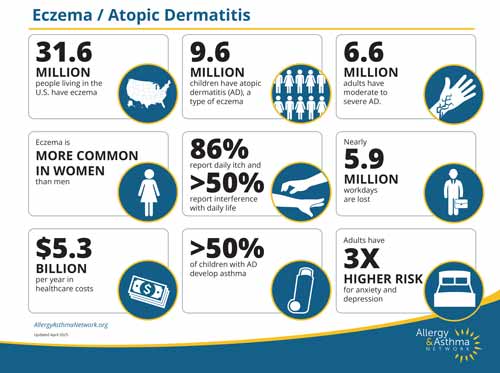
Atopic Dermatitis/
Eczema Statistics
Latex Allergy
Infosheet

Website Resources
Visit the website below for more allergy and asthma advocacy resources.

Generic Access Project
Advocating for policies that promote generic competition and efficient approval of generic medicines.
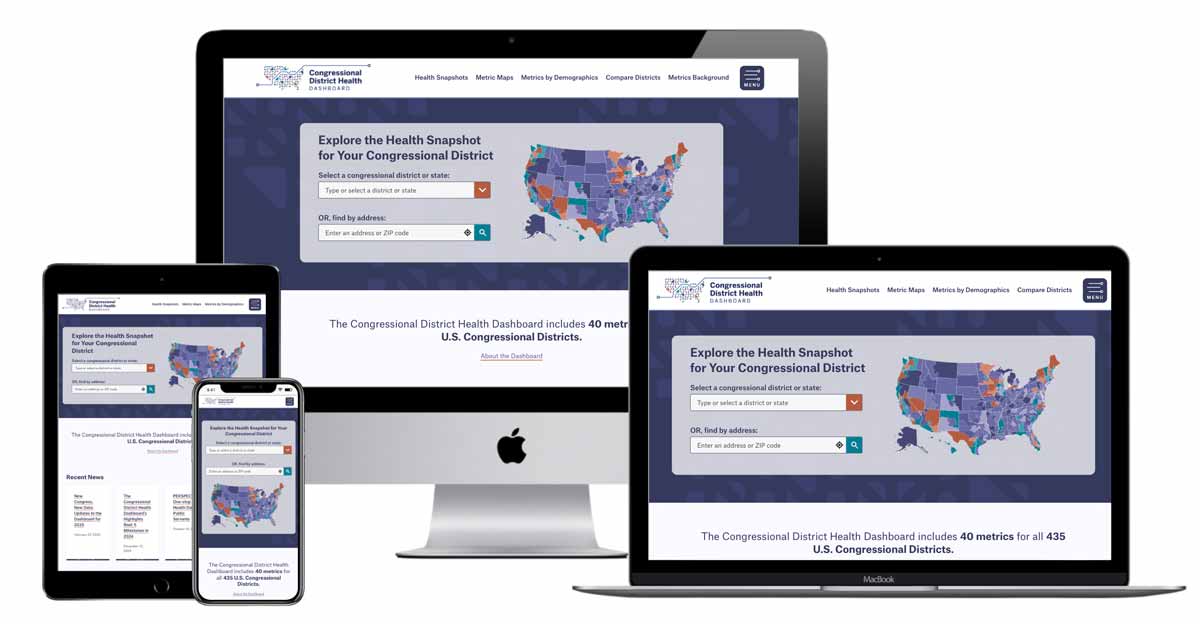
Congressional District Health Website
The Congressional District Health Dashboard includes 40 metrics for all 435 U.S. Congressional Districts.
Find YOUR national legislators to call or meet with them.
Let your legislator know what issues are important to you. Not sure who your lawmakers are? Use this lookup tool to identify your local, state and federal legislators.


